Published on
PerfOps Alerts changelog: PerfOps Analytics integration with Slack and OpsGenie

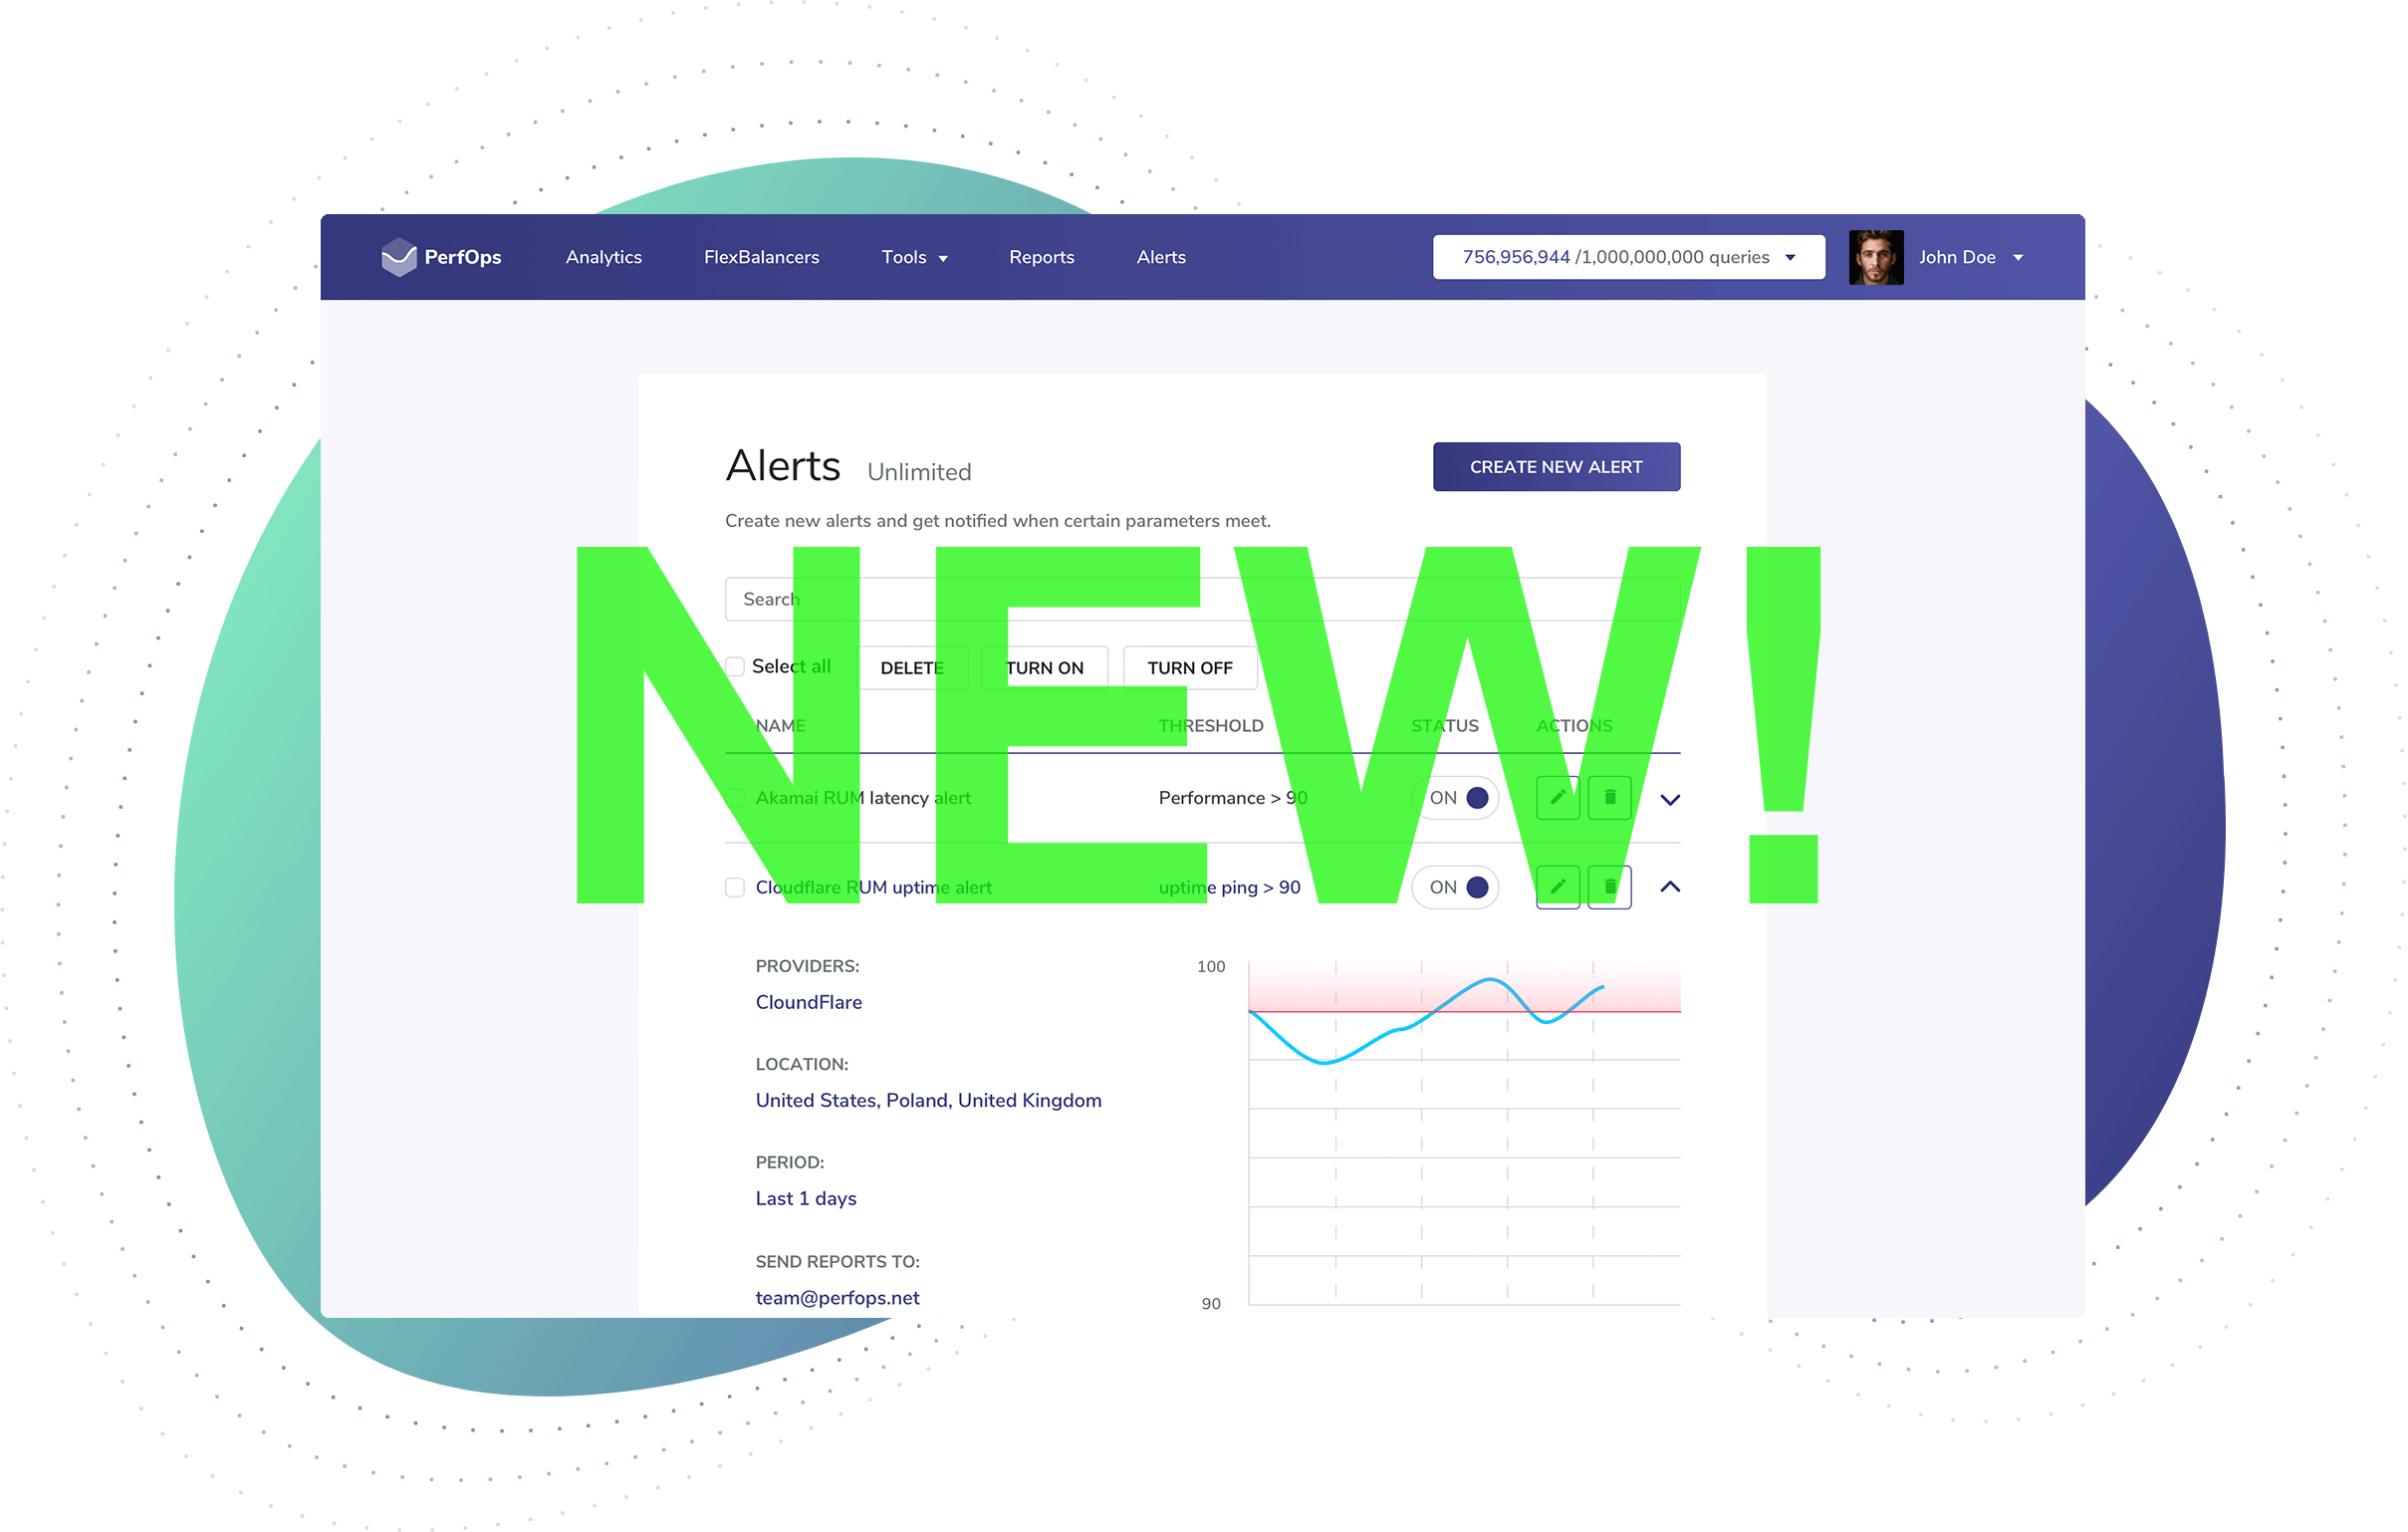
As we have promised, we continue to inform you about our new features. This time we will go after recently implemented Alerts features that can be useful for your CDN Providers performance monitoring (DNS and Cloud Providers performance and uptime as well).
ASN, ISP, City filters for PerfOps Alerts
If you used our Alerts feature before - you know that it allows to set different notification rules. You select CDN (or DNS or Cloud) Provider, set up the rules, for example 'trigger if Performance (Latency) goes equal or above 40ms', when it is triggered - you get a notification, when it goes back to normal (below 40ms) - you also get a notification.
What was changed? We have added the ability to filter by City, ASN and ISP:

As you can see, now we have not only Continent and Country, but three more filters. You can choose the particular city from the list.

Notice, that for DNS/Cloud Providers only cities we have our Synthetic nodes placed in are shown. For CDNs the list is much bigger because we use Real User Monitoring that collects CDN Providers performance and uptime data worldwide:

Simply put, if you are monitoring CDN Providers performance or uptime - you are able to select almost every city on the planet, isn't it great?
And that is not all: now you can add ISP and ASN filters so your monitoring becomes as accurate as possible.
ISP filter:

and ASN filter:

The lists of ASNs and ISPs are also based on real metrics we receive from our test nodes (DNS and Cloud providers performance) and via Real User Monitoring (CDN Providers statistics).
And, of course, you can preview your results, it is very helpful when you determine the threshold number ('greater', 'greater or equal' etc.) :

We have also recorded a short video that illustrates the usage of that new Alerts features which we are talking about. You definitely want to watch it :)
PerfOps Alerts Integration with Slack and Opsgenie
We have also added PerfOps Alerts integration for such well-known business communication platform as Slack and powerful incident management platform as Opsgenie.
The integration process is more than simple. For Slack you should have a link to your Slack incoming webhook URL. Simply paste it to the corresponding field:

After saving it shows Slack as the alert notification channel:

As you can see, in our example we set Cloudflare DNS Provider, 1 minute interval, Performance >= 8 (threshold) and Europe as location.
The Alert is saved and you start receiving Alerts notifications. If the event was triggered, you receive a 'red' notification:

It means that the DNS provider performance went above 8ms. The message also shows all Alert information (condition, trigger value, interval, locations).
And when it goes back to 'normal' (in our case latency goes below 8ms), the 'green' notification comes up:

Now, let's set the same Alert we modified before to Opsgenie channel. Simply edit the alert and change its Name (To 'Test Alert Opsgenie', just to avoid any confusions) and Notification channel info.
Fill in your Opsgenie API URL and Key:

Save the Alert, you can see that its Notification channel is changed:

And you start receiving notifications (when DNS provider performance goes above 8ms):

In details:

So, that's how it works!
The PerfOps Alerts are useful in many cases:
- you are a DNS or CDN provider owner and you want to monitor your service performance and uptime;
- you are building/going to build own complex multi-CDN or multi-Cloud location based infrastructure and need some initial statistics to configure it the best possible way;
- you are testing your DNS Resolver and need to monitor its quality from particular ASN;
- you are just curious :)
Alerts will come in handy in various situations.
Being part of the Enterprise plan, City, ASN and ISP Alerts filters are freely available for our users until February, 2021, and if you are interested in those in future- shoot us an email team@perfops.net.
We are always glad to talk with you!