Published on
New Performance Feature: RUM Raw Logs
Today PerfOps is releasing a new unique feature that allows users to analyze our performance data in even more detail!
From now on, you will be able to access the raw logs for all of our HTTP benchmarks.
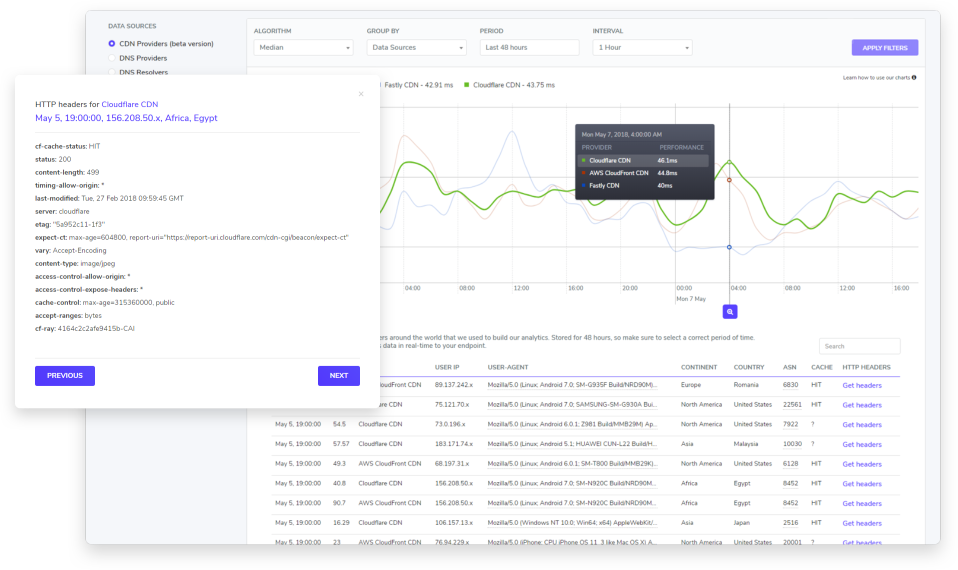
Every single data point that we used to build our charts is available for everyone, along with the full metadata.
You will be able to view information such as query time, anonymized user IP, ASN, user-agent, location, and full HTTP headers for each and every benchmark that we ran.
All are easily accessible via our control panel and API.
In addition, we can also stream this data in real-time to a custom endpoint of your choosing if you already have the analytics infrastructure in place.
You can contact us to get more information about our pricing and potential discounts to get access to Raw Logs.
Additional PerfOps Performance Updates
In the new release of PerfOps we made many improvements:
- We added Cache Hit Ratio data per CDN provider
- CDN data is now available at a per-second interval
- You can drag&drop the charts to load additional data
- You can use Ctrl+Scroll to zoom in and out of data
- Click to pin the tooltip will show you a zoom button that will allow you to accurately zoom inside the selected date
- Based on the selected date-range our system will automatically select the best interval for a better experience